User Interface
The lnav TUI displays the content of the current “view” in the middle, with status bars above and below, and the interactive prompt as the last line.
Screenshot of lnav viewing syslog and web access_log messages.
The default view shows the log messages from the log files that have been loaded. There are other views for displaying content like plaintext files and SQL results. The Views section describes the characteristics of each view in more detail. You can switch to the different views using the hotkeys described in the Display section or by pressing ENTER to activate the breadcrumb bar, moving to the first crumb, and then selecting the desired view. You can switch back to the previous view by pressing q. You can switch forward to the new view by pressing a. If the views are time-based (e.g. log and histogram), pressing Shift + q and Shift + a will synchronize the top times in the views.
The right side of the display has a proportionally sized ‘scrollbar’ that shows:
the current position in the file;
the locations of errors/warnings in the log files by using red or yellow coloring;
the locations of search hits by using a tick-mark pointing to the left;
the locations of bookmarks by using a tick-mark pointing to the right.
Top Status Bar
The top status bar shows the current time and messages stored in the lnav_user_notifications table.
Below the top status bar is the breadcrumb bar that displays the semantic location of the top line in the main view. For example, within a pretty-printed JSON document, it will show the path to property at the top of the view. The actual content of the bar depends on the current view and will be updated as you navigate around the main view. The bar can also be used to navigate around the document by focusing on it.
Breadcrumb Bar
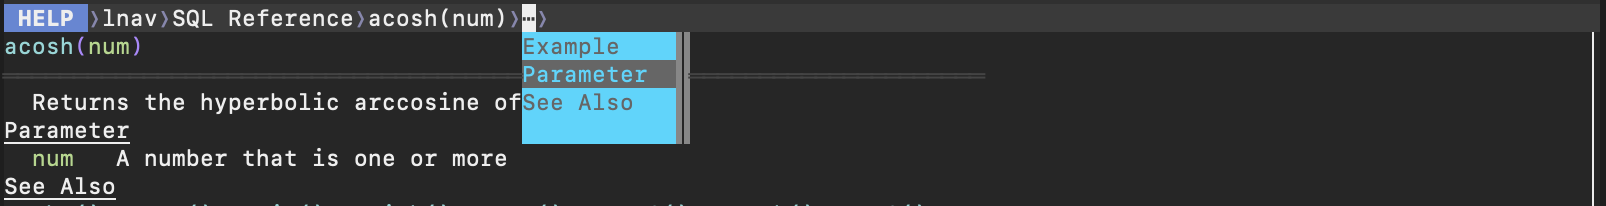
Screenshot of the breadcrumb bar focused and navigating the help text
To focus on the breadcrumb bar, press ENTER. The ←/→ cursor keys can be used to select a crumb and the ↑/↓ keys can be used select a value of that crumb. To accept a value and drop focus on the bar, press ENTER. To accept a value and move to the next crumb, press →. Using → makes it quicker to drill down into a document without having to constantly switch focus. To drop focus on the bar without accepting anything, press Escape.
There are three types of crumbs:
a dropdown where one of a limited set of values can be selected;
a combobox where a value can be entered directly or selected;
a numeric input for entering array indexes.
When a dropdown or combobox is selected, you can type part of the desired value to filter the list of values. For example, the first crumb is always the current view, typing in “hi” will filter the list down to the “HIST” value.
Configuration Panels

Screenshot of the header for the configuration panels when they are hidden.
After the main view content, there is a header bar for two configuration panels: Files and Filters. These panels provide visual access to parts of lnav’s configuration. To access the panels, press the TAB key. To hide the panels again, press q.
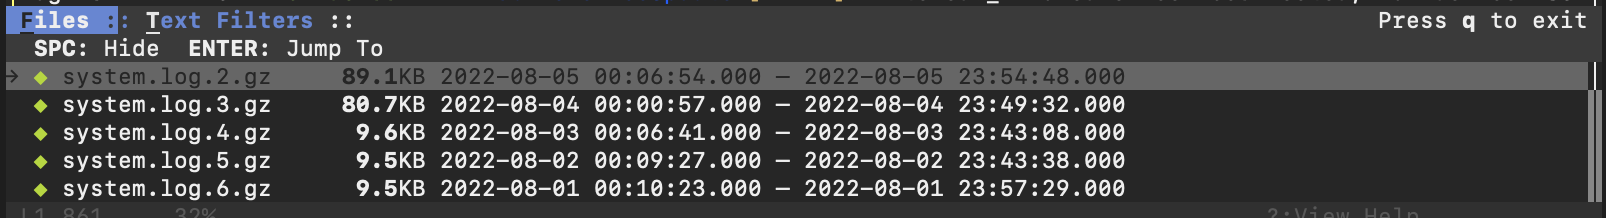
Screenshot of the files panel showing the loaded files.
The Files panel is open initially to display progress in loading files. The following information can be displayed for each file:
the “unique” portion of the path relative to the other files;
the amount of data that has been indexed;
the date range of log messages contained in the file;
the errors that were encountered while trying to index the file;
the notes recorded for files where some automatic action was taken, like hiding the file if it was seen as a duplicate of another file.
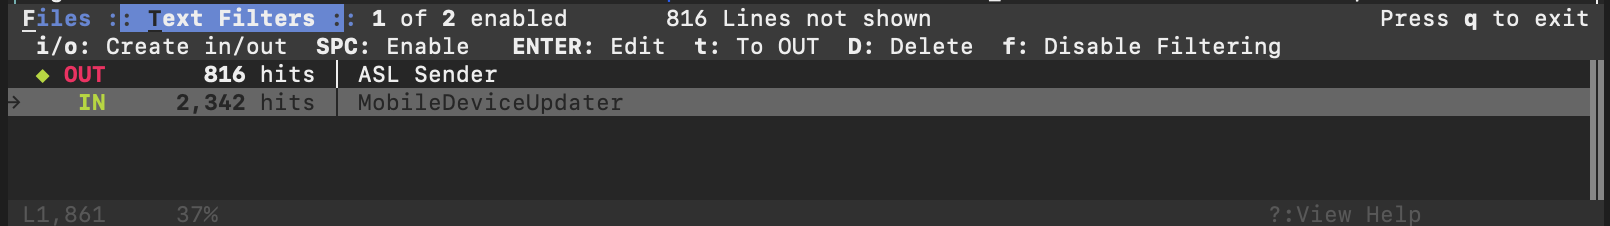
Screenshot of the filters panel showing an OUT and a disabled IN filter.
If the view supports filtering, there will be a status line showing the following:
the number of enabled filters and the total number of filters;
the number of lines that are not displayed because of filtering.
To edit the filters, you can press TAB to change the focus from the main view to the filter editor. The editor allows you to create, enable/disable, and delete filters easily.
Bottom Status Bar
The second to last line is the bottom status bar, which shows the following:
the line number of the top line, starting from zero;
the location within the view, as a percentage;
the current search hit, the total number of hits, and the search term;
the loading indicator.
When the interactive prompt is active, this bar can show the prompt description, help text, or error message.
Prompt
Finally, the last line on the display is where you can enter search patterns and execute internal commands, such as converting a unix-timestamp into a human-readable date. The following key-presses will activate a corresponding prompt:
/ - The search prompt. You can enter a PCRE-flavored regular expression to search for in the current view.
: - The command prompt. Commands are used to perform common operations.
; - The SQL prompt. SQL queries can be used for log analysis and manipulating lnav’s state.
| - The script prompt. Enter a path to the lnav script to execute, along with the arguments to pass in.
The command-line is by the readline library, so the usual set of keyboard shortcuts can be used for editing and moving within the command-line.
Views
The accessible content within lnav is separated into the following views.
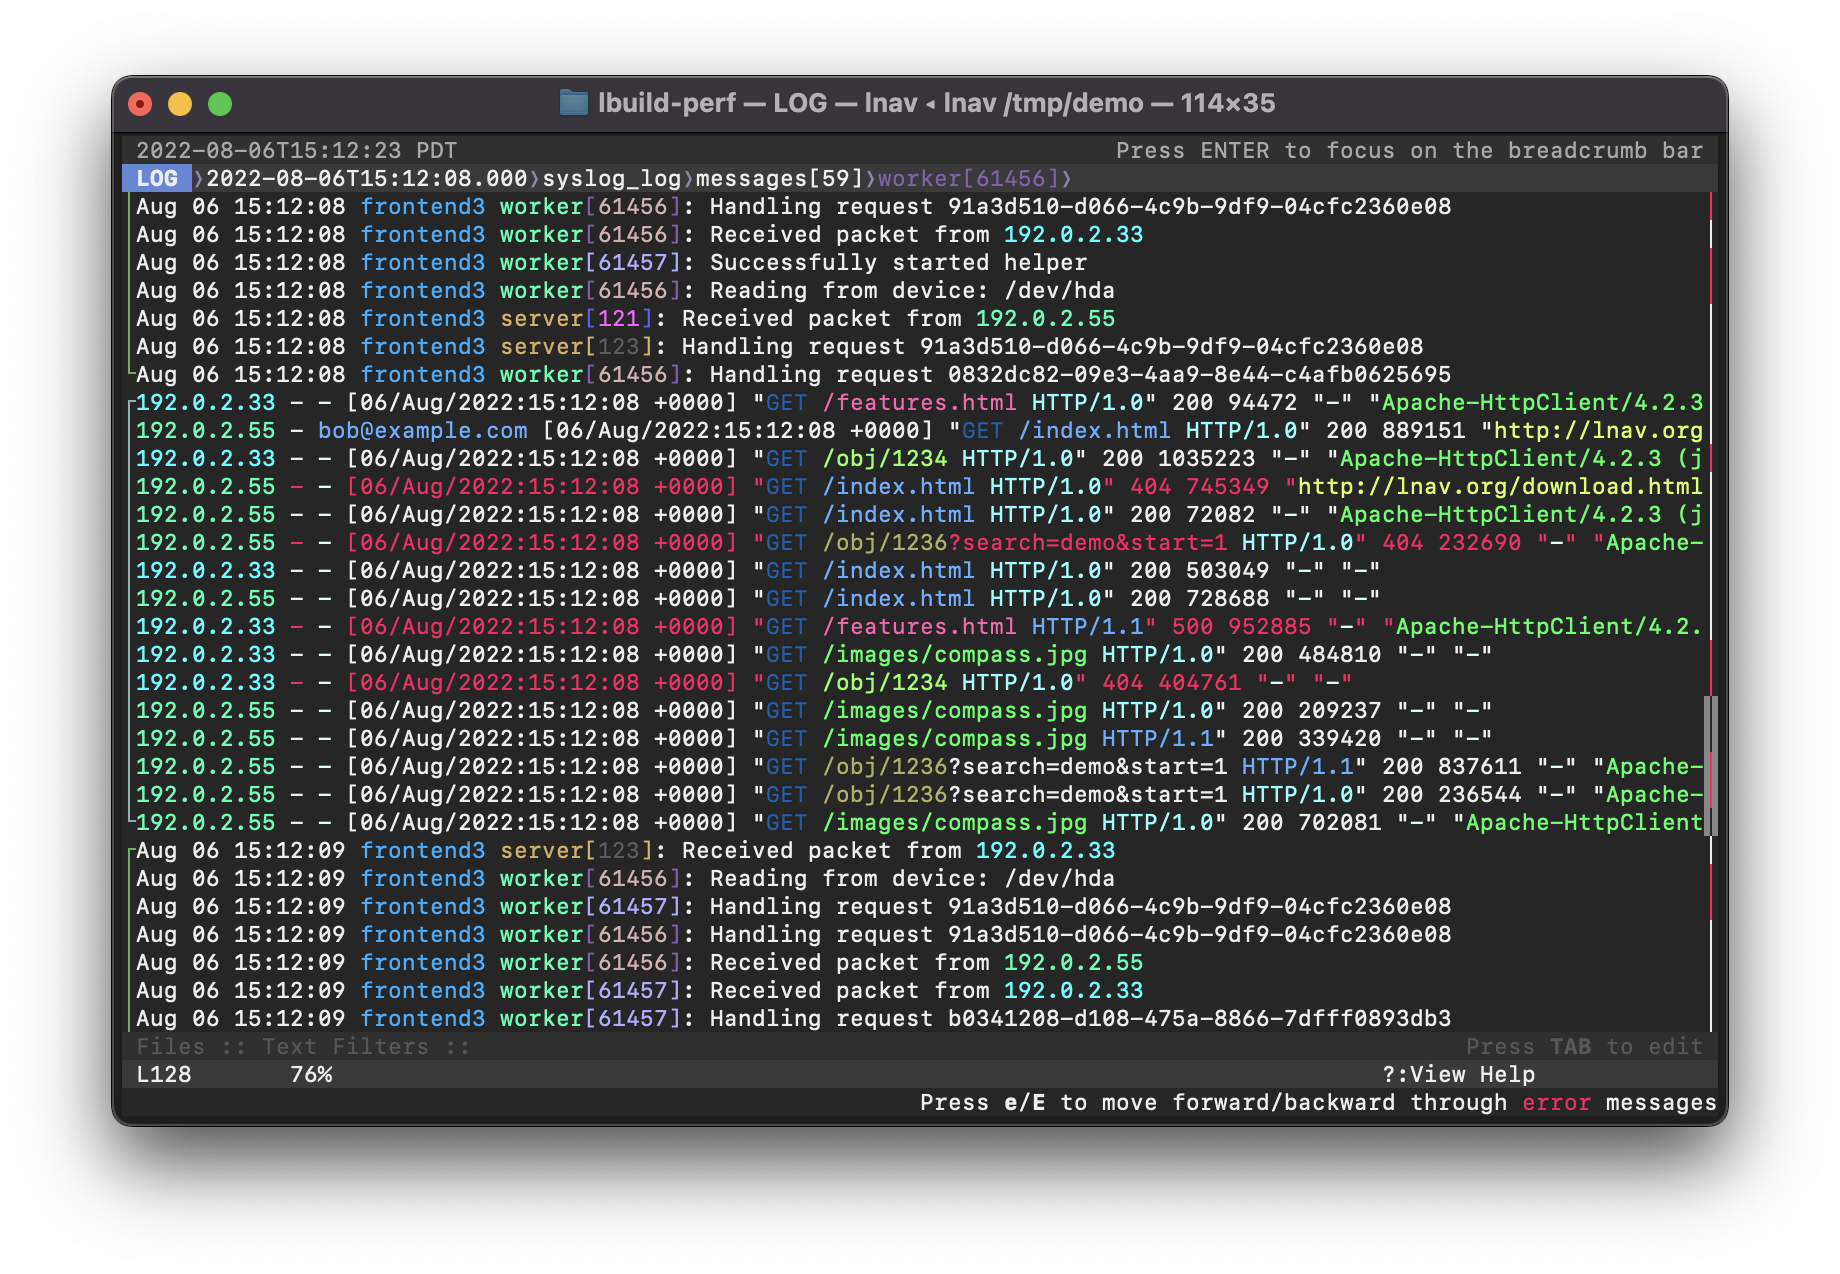
LOG
The log view displays the log messages from any loaded log files in time order. This view will be shown by default if any log messages are available.
On color displays, the log messages will be highlighted as follows:
Errors will be colored in red;
warnings will be yellow;
search hits are reverse video;
various color highlights will be applied to: IP addresses, SQL keywords, XML tags, file and line numbers in Java backtraces, and quoted strings;
“identifiers” in the messages will be randomly assigned colors based on their content (works best on “xterm-256color” terminals).
Note
If the coloring is too much for your tastes, you can change to the “grayscale” theme by entering the following command:
:config /ui/theme grayscale
Note
If a log message has a timestamp that is out-of-order with its neighboring messages, the timestamp will be highlighted in yellow. When one of these messages is at the top of the log view, an overlay will display the difference between the “actual time” and the “received time”. The “actual time” is the original textual timestamp. The “received time” is the time of an earlier message that is larger than this log message’s time.
The breadcrumb bar will show the following crumbs:
the timestamp for the top line;
the log format for the top line;
the name of the file the top line was pulled from;
the “operation ID” of the top log message, if it is supported by the log format.
These crumbs are interactive and can be used to navigate to different parts of the log view. For example, selecting a different value in the log format crumb will jump to the first message with that format.
TEXT
The text view displays files for which lnav could not detect any log messages.
Markdown
Files with an .md (or .markdown) extension will be treated as
Markdown files and rendered separately.
DB
The DB view shows the results of queries done through the SQLite interface. You can execute a query by pressing ; and then entering a SQL statement. You can switch to the SQL view by pressing v.
HELP
The help view displays the builtin help text. Press ? to switch to the help view at any time. While in the help view, the breadcrumb bar can be used to navigate to different sections of the document.
HIST
The histogram view displays a stacked bar chart of messages over time classified by their log level and whether they’ve been bookmarked. Press i to switch back and forth to the histogram view. You can also press Shift`+:kbd:`i to toggle the histogram view while synchronizing the top time. While in the histogram view, pressing z/Shift`+:kbd:`z will zoom in/out.
PRETTY
The pretty-print view takes the text displayed in the current view and shows the result of a pretty-printer run on that text. For example, if a log message contained an XML message on a single line, the pretty-printer would break the XML across multiple lines with appropriate indentation.
SCHEMA
The schema view displays the current schema of the builtin SQLite database.
SPECTRO
The spectrogram view is a “three”-dimensional display of data points of a log field or a SQL query column. The dimensions are time on the Y axis, the range of data point values on the X axis, and the number of data points as a color. For example, if you were to visualize process CPU usage over time, the range of values on the X axis would be CPU percentages and there would be colored blocks at each point on the line where a process had that CPU percentage, like so
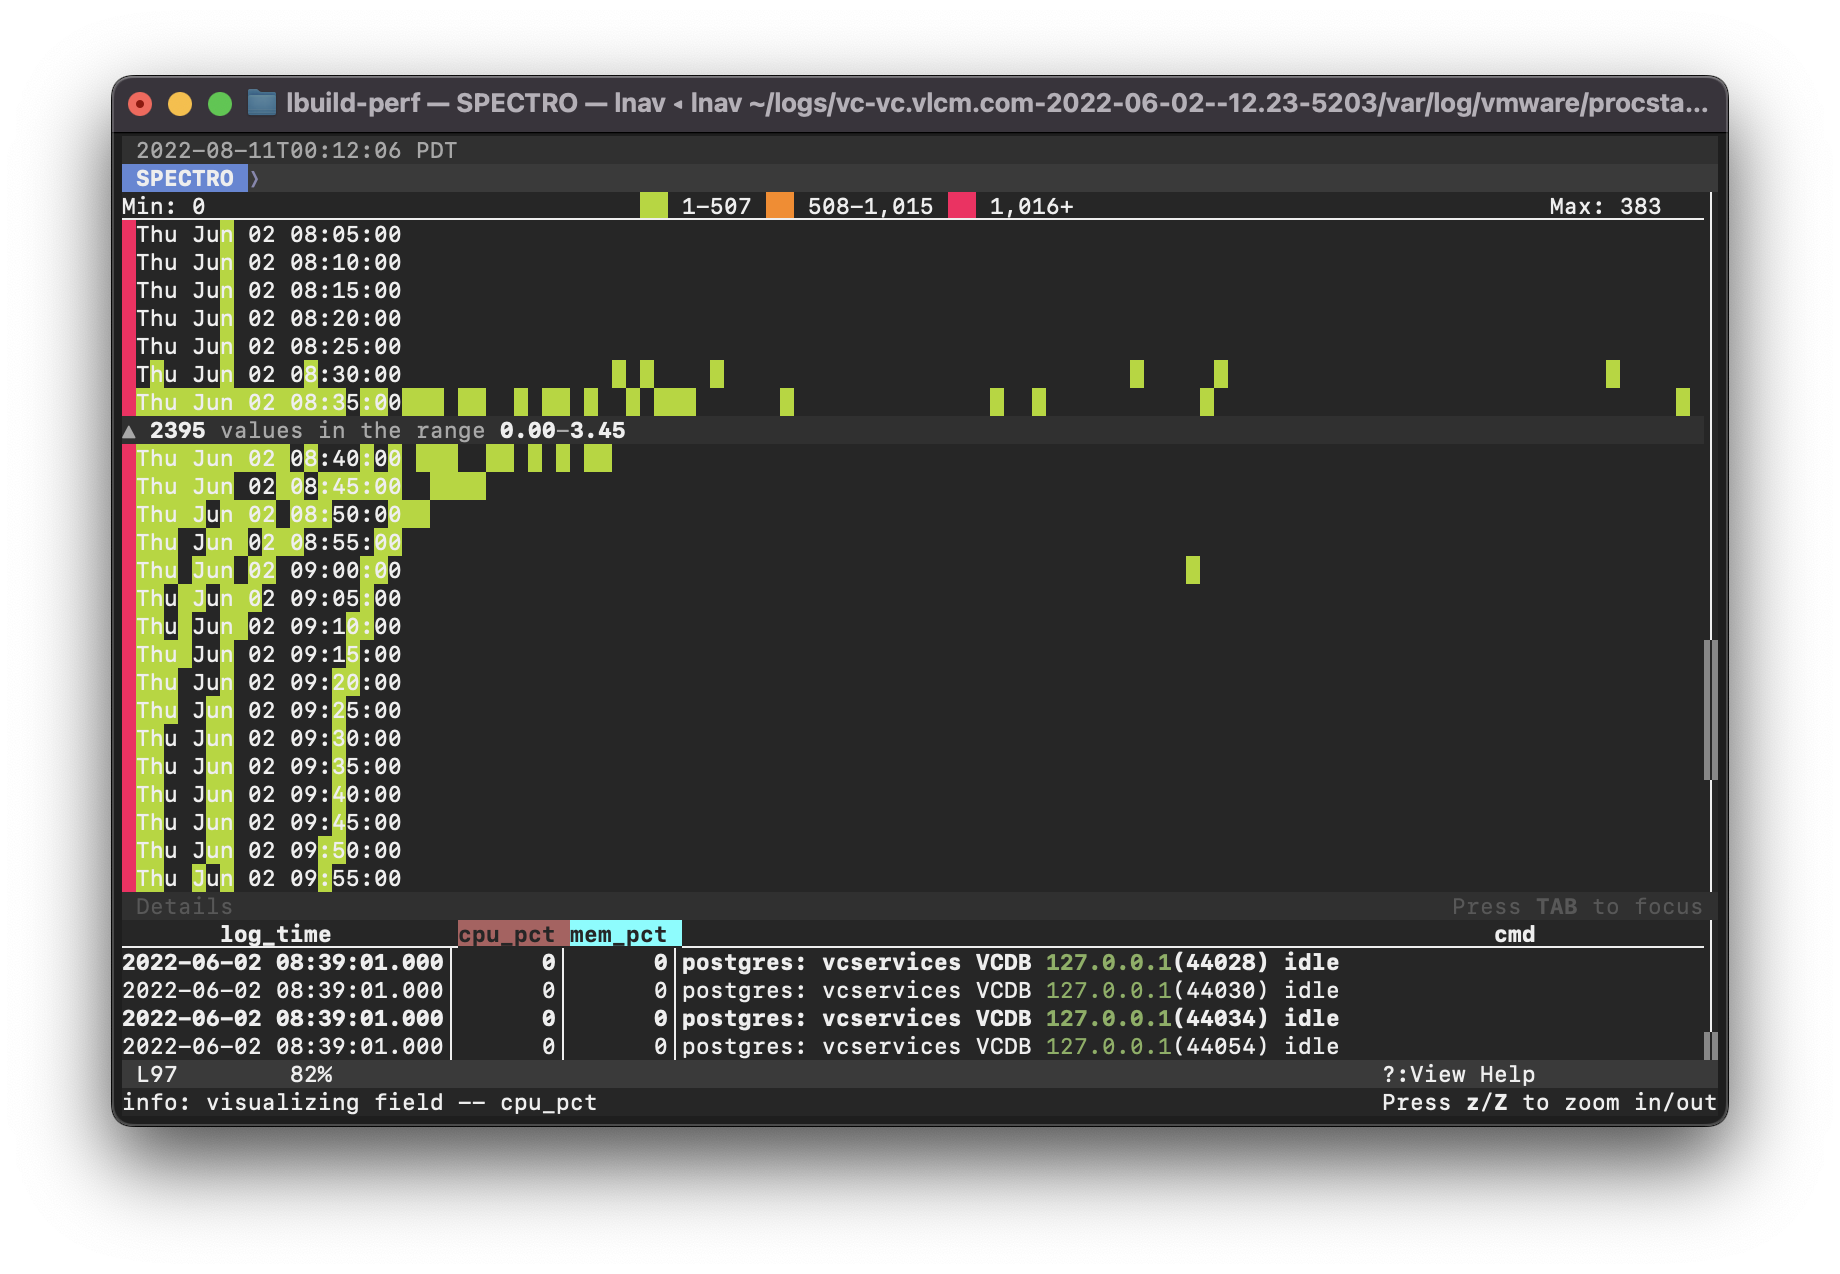
Screenshot of the lnav spectrogram view showing CPU usage of processes.
The colors correspond to the relative number of data points in a bucket. The legend overlaid at the top line in the view shows the counts of data points that are in a particular color, with green having the fewest number of data points, yellow the middle, and red the most. You can select a particular bucket using the cursor keys to see the exact number of data points and the range of values. The panel at the bottom of the view shows the data points themselves from the original source, the log file or the SQL query results. You can press TAB to focus on the details panel so you can scroll around and get a closer look at the values.